Olympics History Analysis
Introduction
Discover the captivating history of the Olympic Games as we dive into the depths of data analysis. Unveiling intriguing trends and remarkable stories, this project unveils the evolution and impact of this iconic global event.
Men & Women through the Olympics History
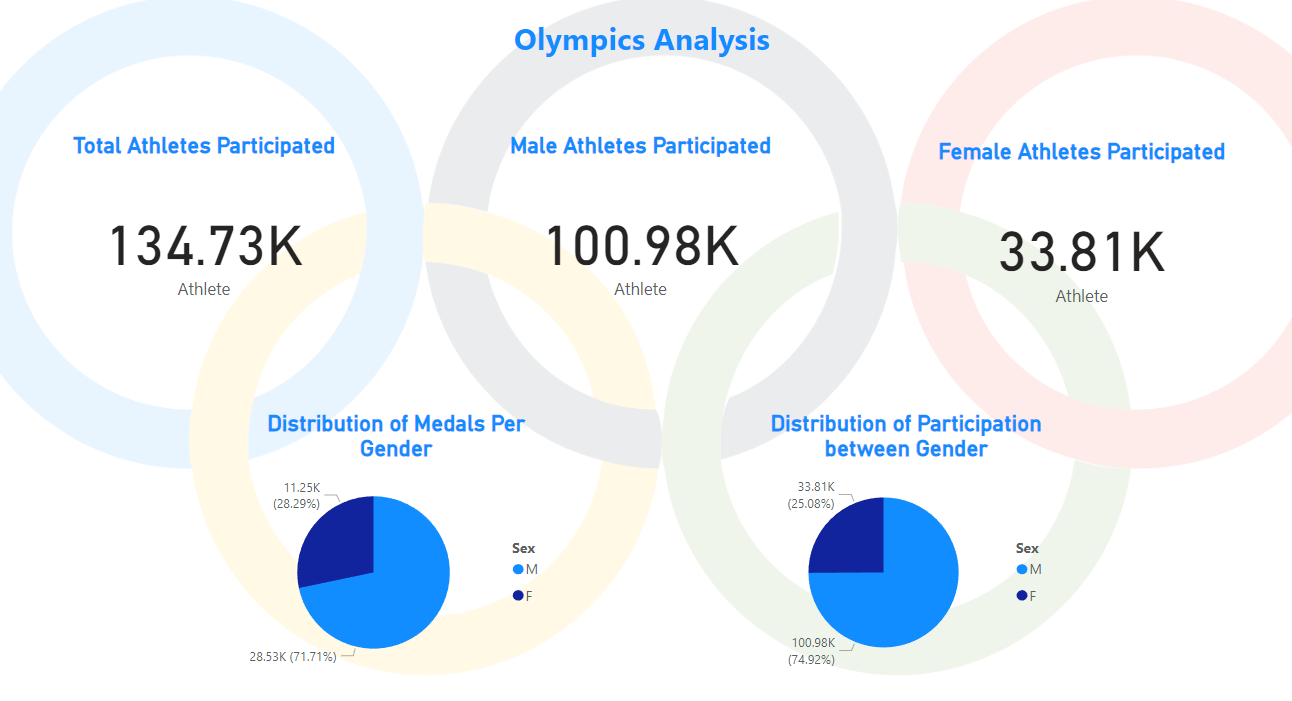
Men vs Women Participation Percentage
We See from the next pie chart that the Participation percenatge of men is more than the women , and that makes sense because the first Olymbics Games hosted in 1896 , and the first Olymbics with women Participation was 1900 but with small number of players about 22
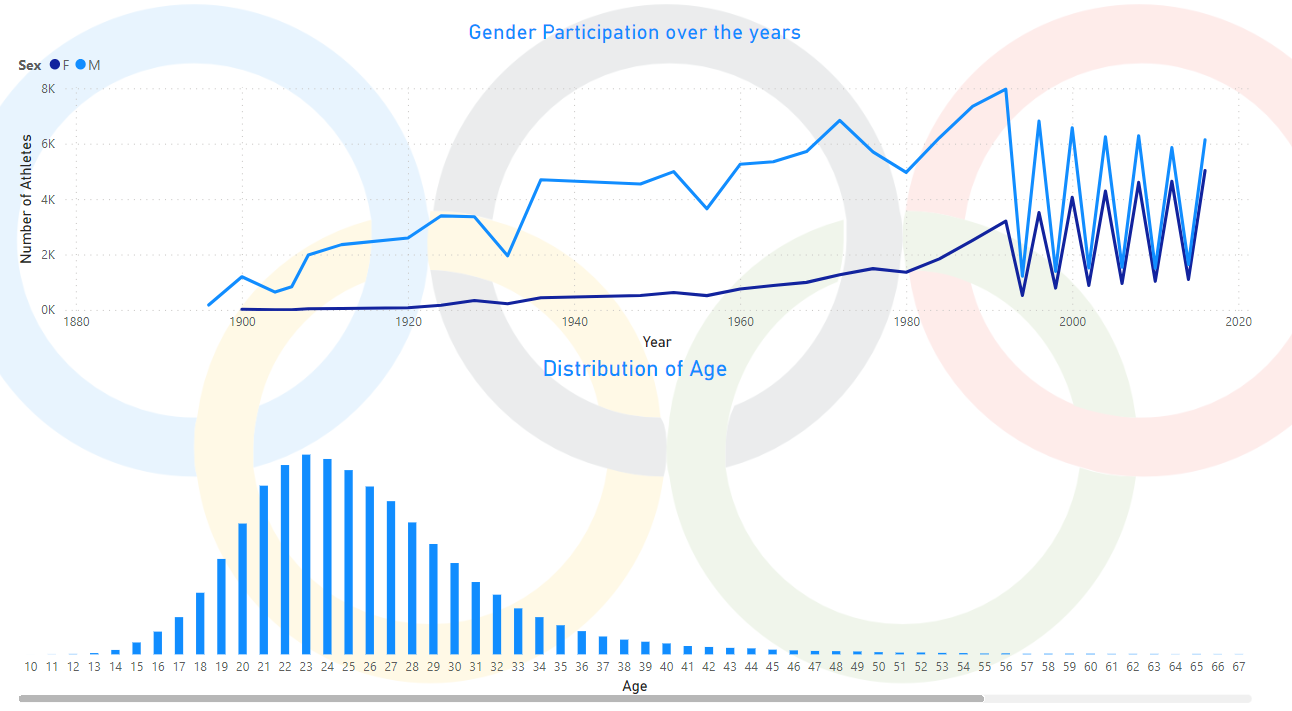
Men vs Women Participation through the years
We Can see here that the Participation of women increased over the years
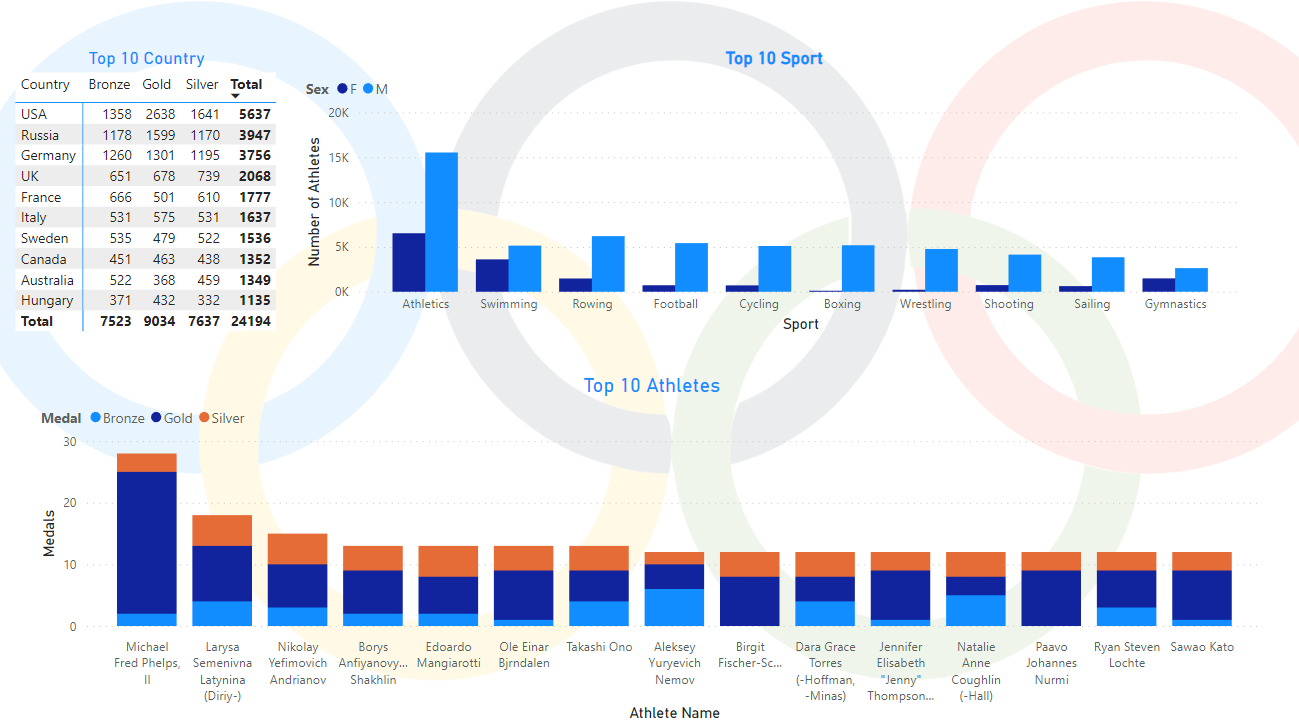
Top 20 Countries by the number of women athletes
Countries through the history if the Olymbics
Through the history of the Olympics , about 230 countries have participated in the Olymbics
Top 10 Countries by the number of players
Top 20 Countries by the total number of Medals
Arabs Countries
Athletes through the history if the Olympics
There are about 135,000 athletes the participated in the Olympics through the year
Top 20 Athletes by the number of medals
POWER BI Dashboard